Industry moves to data-driven proactive control with real-time visualisation
Reading time: 4 min
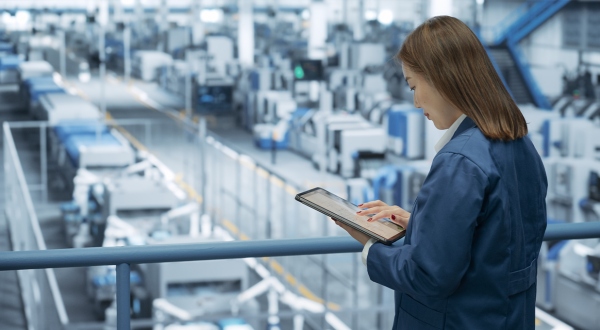
In an increasingly demanding industrial context, real-time visualisation is transforming raw data flows into clear and usable indicators, offering manufacturers full, instant visibility of their operations.
Factories have long been gathering data, most often in the form of static reports produced hours, if not days, after the data is collected, which prevents their teams from acting before a problem worsens. Technological advances have brought about a solution to reduce or eliminate this time lag: real-time visualisation.
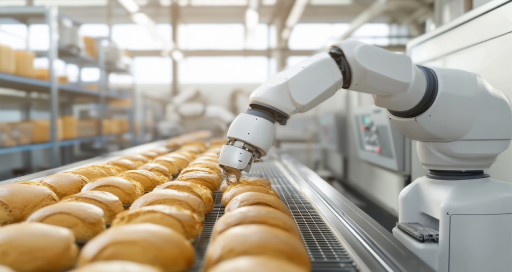
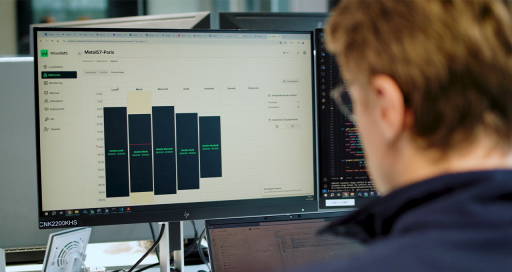
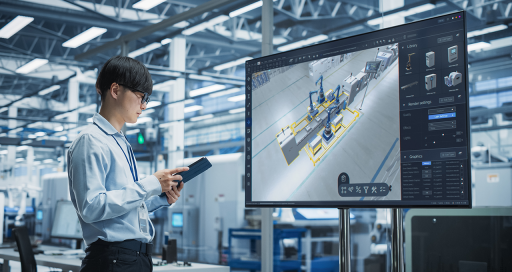
How does it work? Data obtained from machines, sensors, robots and IT systems (SCADA, MES, etc.) are centralised and displayed instantly on dynamic dashboards featuring graphs, diagrams and heat maps. “This makes it possible to identify problems as soon as they occur, to reduce if not eliminate unplanned stoppages, improve OEE [overall equipment effectiveness], maintain consistent product quality and optimise energy consumption,” explains Josiah Rodriguez, Data Science Engineer at Actemium Avanceon, a VINCI Energies business unit based in Pennsylvania, USA, and a specialist in this technology.
This shift from a fragmented and backward-looking view to a unified real-time overview, shared and accessible to everyone, is transforming production management. This provides improved monitoring of operations, allowing process optimisation and improved collaboration throughout the factory and remotely.
Real-time visualisation also opens the way to preventive and predictive maintenance. “It becomes possible to integrate machine-learning models to anticipate faults,” says Josiah Rodriguez. “For example, analysis of vibrations, temperature and other indicators helps predict when a motor, pump or generator risks developing a fault.” Businesses can then plan their maintenance based on the actual status of the equipment rather than a more-or-less arbitrary schedule, potentially making substantial cost savings.
A combination of expertise
To support its customers through the implementation of these solutions, Actemium Avanceon takes a pragmatic, customised approach. “Each manufacturer is taking their digital transformation at their own pace,” says Josiah Rodriguez. “Some still use paper a lot; others are already using data historians [specialised software that collects and stores large volumes of time-series data from industrial processes], SQL databases or more sophisticated systems.”
The Actemium Avanceon teams begin with a ground-up diagnostic, including an analysis of existing processes and data flows, before recommending the most suitable technologies: partner platforms such as AVEVA, Ignition or TwinThread, or custom dashboards built using Plotly Dash. They then help the customer’s teams with the connections between IT systems and operational technologies, and with ways to harness the data.
“Real-time visualisation is shifting industry from a reactive approach to a proactive approach based on data.”
“Our added value resides in our ability to make sense of complex, disorganised data,” adds Josiah Rodriguez. “The information gathered does not always reflect what the teams are seeing in the real world. We combine our expertise in engineering and data science to help our customers understand, trust and use their data effectively. This hybrid approach can often highlight previously invisible problems – such as incorrect yield calculations or defective sensors – that had been making reports inaccurate.”
Once the benefits – reduced stoppages and improvements in efficiency, quality and safety – have been recognised on a pilot line, a rollout across the entire production site usually quickly follows. Josiah Rodriguez cites the example of TwinThread, an industrial cloud platform. “Our collaboration with them enabled us to optimise energy consumption in the cooling systems and to reduce rejection rates by identifying the underlying causes of raw material wastage.”
Proactive production management
Advances in artificial intelligence and machine learning, combined with the proliferation of collection, storage and visualisation solutions designed specifically for industry, are opening up unprecedented new fields of innovation and customisation.
To sum up, says Josiah Rodriguez, “Real-time visualisation is shifting industry from a reactive approach based on static reporting to a proactive approach led by data and insights.” By making data immediately visible, understandable and actionable, this technology is becoming a pillar of operational excellence and competitiveness supporting the advance of Industry 4.0.
03/16/2026